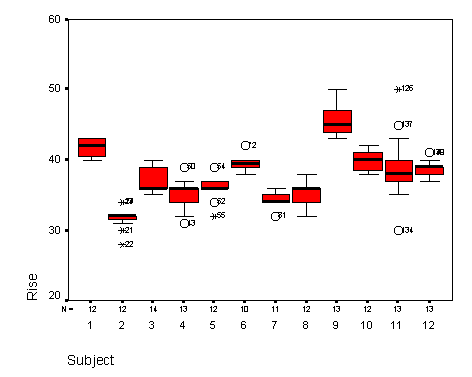
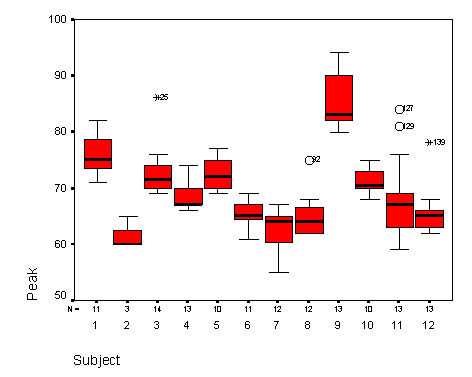
Examples of timings for PET headcurves
These figures are from times of headcurve rises and headcurve peaks estimated by the radiographers during 12 activation PET scans at the Hammersmith Hospital. There is some variation from one radiographer to another in the estimates, but only in the order of 4 seconds or so. The peak is more difficult to time than the rise because the curve flattens out quite slowly. Times are in seconds from the water bolus injection time start, and therefore (in general) the same as [time of scan start + 30 seconds].
Rise times of headcurve by subject

Peak headcurve times by subject
 Matthew Brett 11/10/99
