Frequency domain artefacts in CBU MEG data
One known disadvantage of MEG is its sensitivity to remote magnetic noise sources, such as electrical equipment and moving metal objects. Our MEG is housed in a magnetically shielded room (MSR), which at the CBU is “light-shielded”, i.e. not has effective as in some other MEG labs due to structural building constraints. However, our site is generally considered very quiet by MEG standards.
In many cases, noise from distant sources can be effectively mitigated using Maxfilter (Signal Space Separation, SSS), especially when the source is far enough from the scanner. However, some noise sources can be transient, and their impact may vary depending on the type of analysis you're conducting and the equipment used during acquisition.
This is particularly important for between-group and longitudinal studies, where consistency in noise levels is critical. We are running regular lab checks to make sure our MEG scanner is working as expected. Nevertheless, we suggest that every researchers inspects their own data carefully. There are also know artefacts that so far we have not been able to remove.
To help ensure data quality, we recommend several checks:
- Inspect your raw data in both the time and frequency domains.
- Always apply SSS/Maxfilter where appropriate.
- Where relevant, assess group or longitudinal differences in baseline activity.
- Take empty-room recordings to help identify noisy sessions or external artefacts—these may also be useful in later analyses for testing between-group or longitudinal effects.
- Additional noise reduction methods, such as spectral filtering or ICA, may also be helpful, although they usually deal with physiological artefacts such as eye blinks or heart activity.
- Keep a record of any changes to acquisition equipment during your study, and include tests for stimulus quality in your protocol.
Known MEG artefacts at the CBU
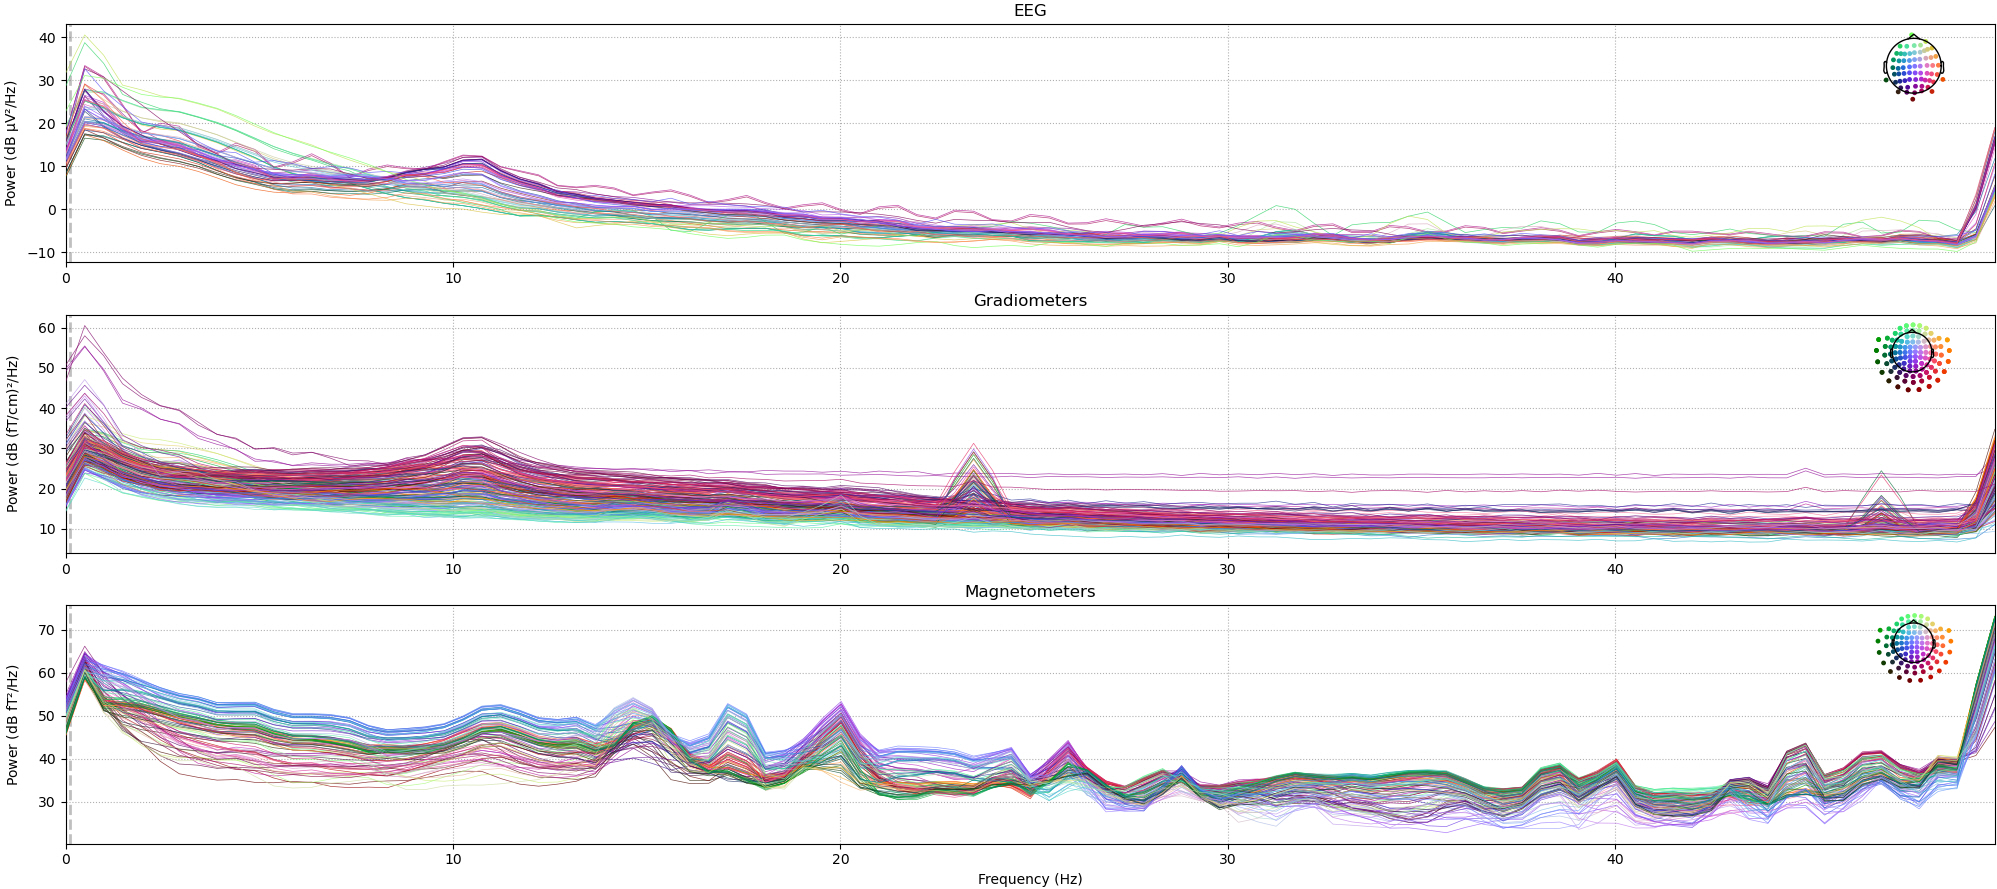
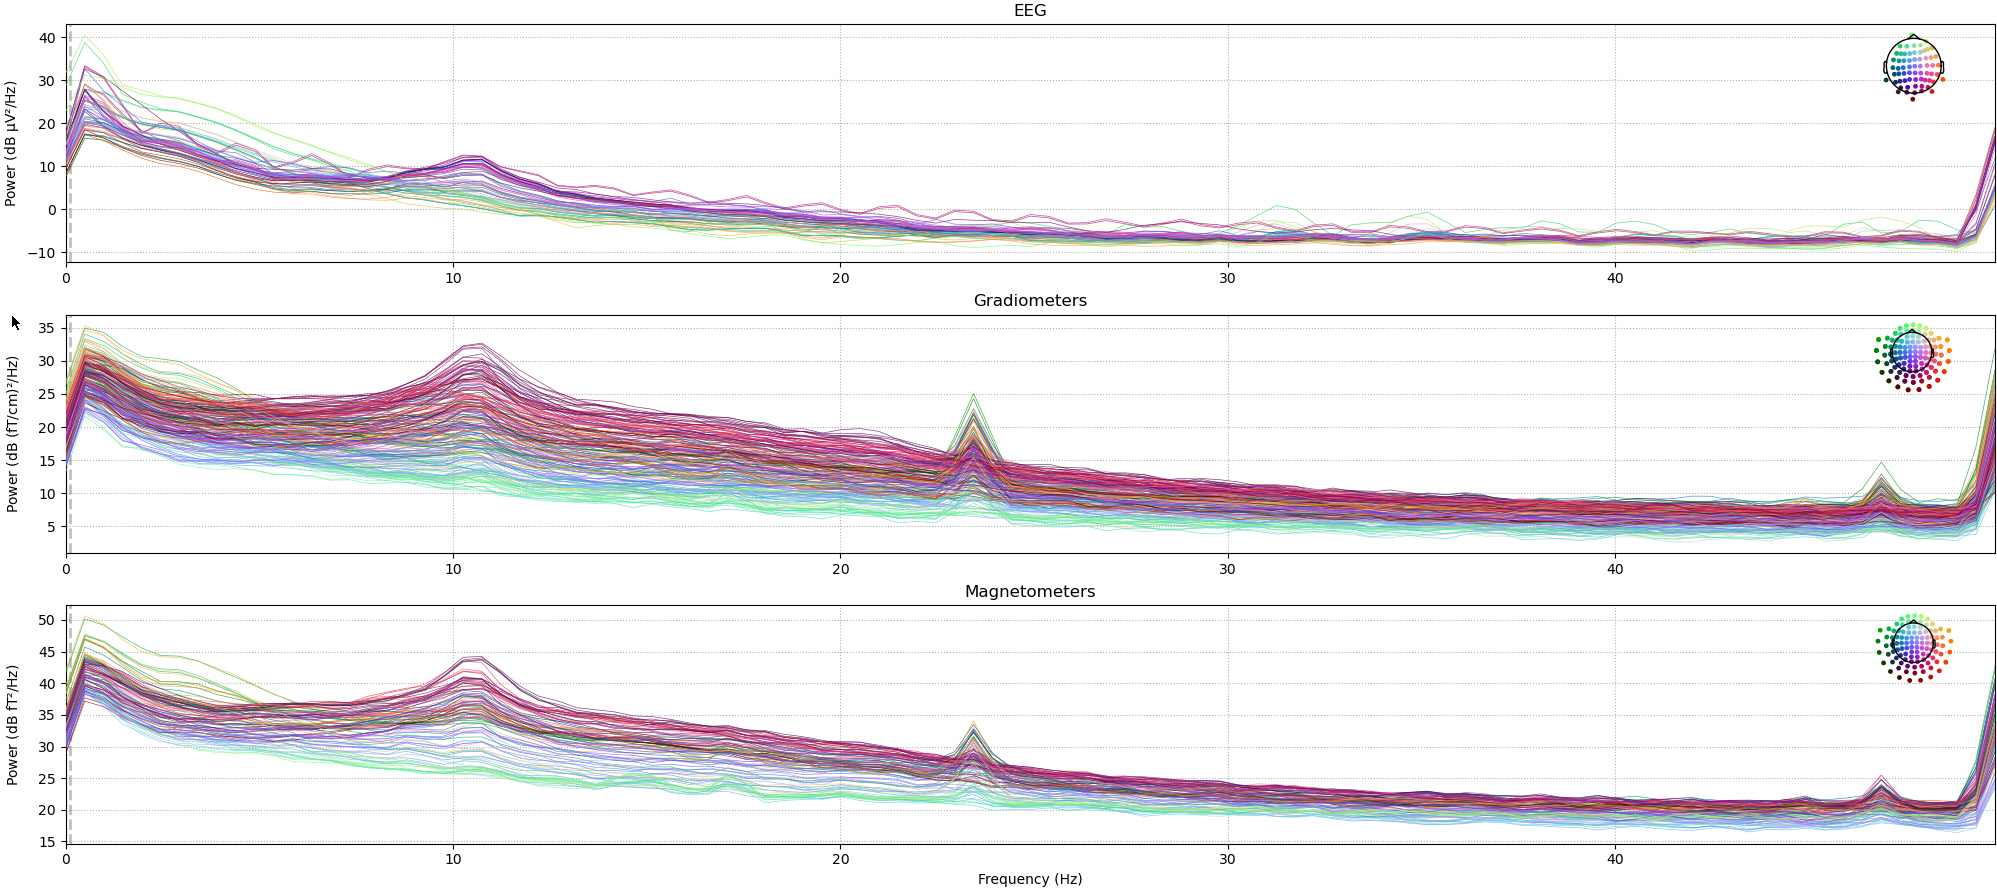
Below are examples of frequency spectra (power spectral densities) for a real recording with participant. The first figure shows data before and the second one after Maxfilter/SSS. Note that EEG is unaffected by Maxfilter/SSS.
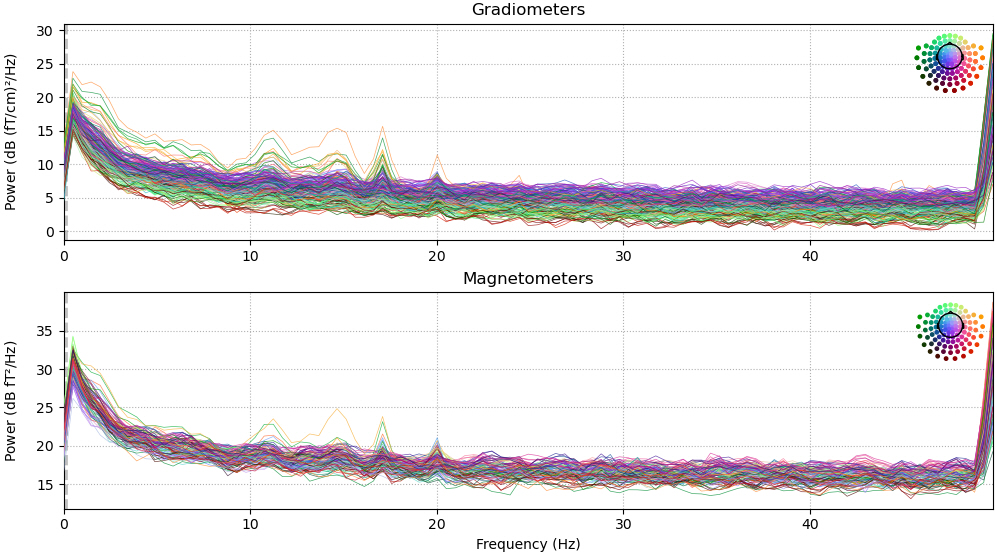
The y-axis of these plots represents decibels, i.e. it is a logarithmic scale of signal power. Power falls off approximately linearly, apart from a peak around 10Hz which is due to the ubiquitous alpha rhythm (present in all three sensor types). Signals from external noise sources are usually larger in magnetometers, since the gradiometers record the difference between two neighbouring coils, thus cancelling out near-homogenous signals from distant sources.
It is therefore not surprising that magnetometers look noisier, and show a number of peaks in their spectrum. However, Maxfilter/SSS suppresses most of them effectively (more about this later though). We cannot trace the origin of all of these peaks. Signal around 15 Hz is likely due to vibrations of the magnetically shielded room. The peak at 20 Hz is due to the extractor fan of our air conditioning system. Note that our air condition system is not on during weekends, i.e. this artefacts may not be present in all recordings. Importantly, these peaks are not visible in the data after Maxfilter/SSS, which has therefore successfully suppressed these artefacts.
This is not the case for the peak at 23.45 Hz. Before Maxfilter/SSS, it only appears in gradiometers, indicating that it is not caused by an external source (which should be larger or at least present in magnetometers). We believe that it reflects interference of radio frequency signals transmitted into the MSR via the power cable of the eye-tracker, and interacting with gradiometers only. If you do not need the eye-tracker, you can avoid the artefact by disconnecting the corresponding cable before the recording (please talk to your MEG operator).
Unfortunately, the artefact at 23.45 Hz is not removed by Maxfilter/SSS. This is likely due to the fact that it is not caused by a “typical” distant source that Maxfilter is designed to suppress. Instead, the signal is attenuated but also projected into magnetometers.
This artefact should not be a problem for you if you
- compute event-related fields, since it is not time-locked to stimulus presentation and will average out.
- run within-subject analyses, as the artefact should not systematically vary across recording sessions.
However, it is not predictable how the artefact may affect some analyses in the frequency domain before you compute contrasts, e.g. functional connectivity analysis.
If you are worried that this artefact may affect your analysis, you have several options:
- Exclude frequency bins around 23.45 Hz from your analysis.
- Apply a Notch filter.
- Use signal space projection (SSP) to remove activity from this frequency range.
EEG/MEG frequency spectrum before Maxfilter/SSS (Triux):
EEG/MEG frequency spectrum after Maxfilter/SSS (Triux):
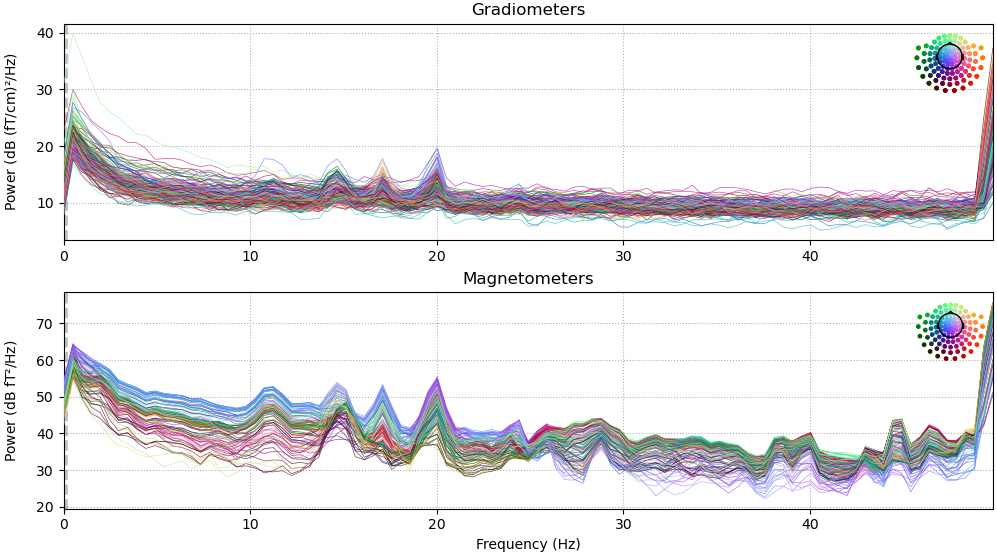
The following two pictures show spectra for empty-room recordings (no participant) before and after Maxfilter/SSS. While small peaks remain after Maxfilter/SSS, their amplitudes are greatly reduced compared to the real participant data shown above.
Note that the 23.45 Hz artefact is not visible in these recordings because the eye-tracker was not in front of the dewar.
Empty-room recording (no participant) before Maxfilter/SSS (Triux):
Empty-room recording (no participant) after Maxfilter/SSS (Triux):
Effect of system upgrade
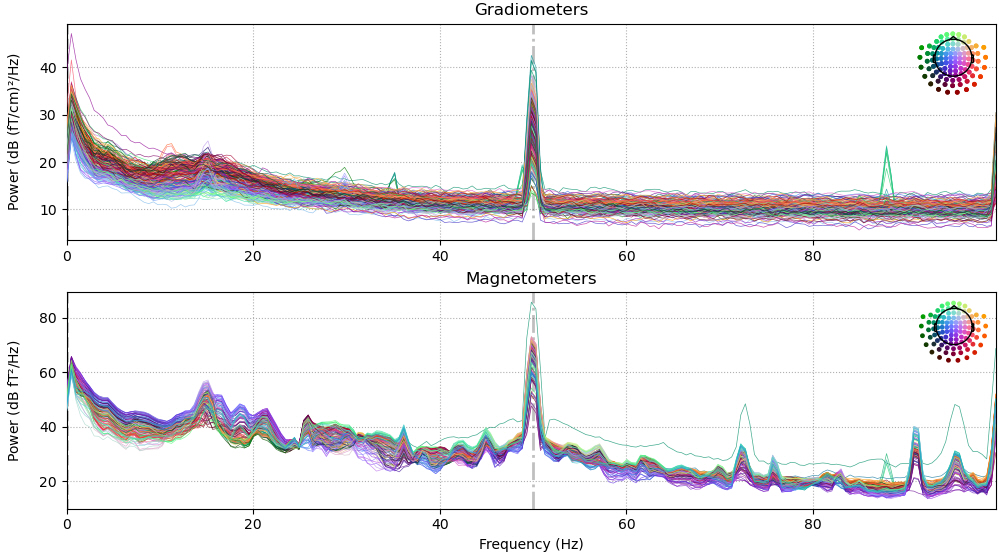
We upgraded our MEG system from a Vectorview to Triux neo system in March 2020. While the general design of the system remained the same, its sensitivity to different noise sources may have changed. For example, we observed an artefact at 88 Hz with the Vectorview system, which was related to the signals of the HPI coils. In the example below, this was successfully suppressed by Maxfilter/SSS. We also observed peaks at about 30 Hz, although not in all recordings. The source of this artefact is unknown.
The following two spectra are examples from our old Vectorview system. This time, a frequency range up to 100 Hz is shown in order to include the 88 Hz artefact.
EEG/MEG frequency spectrum before Maxfilter/SSS (Vectorview):
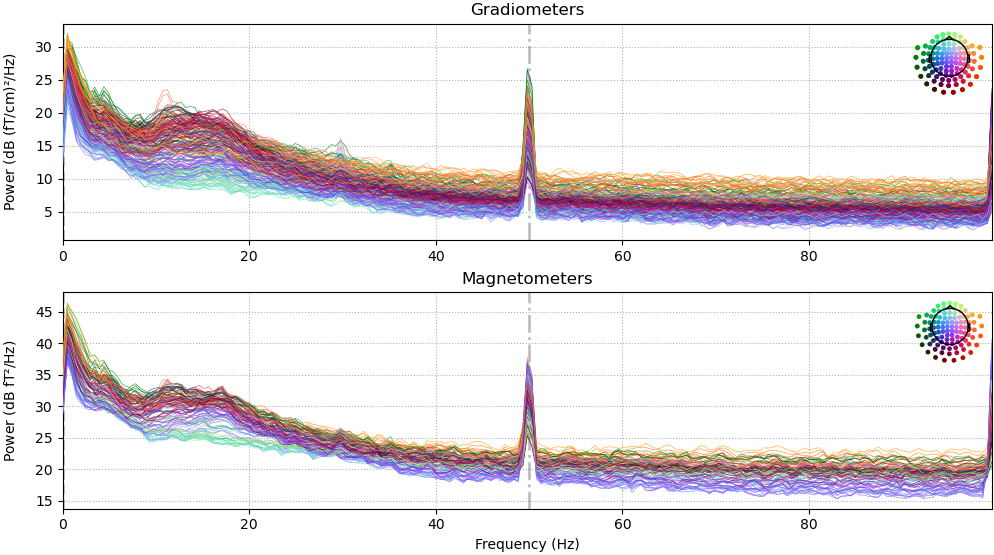
EEG/MEG frequency spectrum after Maxfilter/SSS (Vectorview):
