Reporting SPM results at uncorrected p value thresholds
When reporting results at an uncorrected p value threshold, we often want to be able to conclude that the results we see are reliable.
By 'reliable' we often mean the usual 'if the data here is actually random, and I repeated this experiment many times, is there a low (0.05) probability I would see anything at my chosen threshold by chance'.
If that's the reliable you want, then p<0.001 is not useful - you will need a familywise error rate method giving a false positive rate of 0.05, either for the whole volume or corrected for specified volumes of interest.
Of course, with the standard statistical measure of reliability, you run the risk of false negatives, because you have strongly controlled for false positives. If you want to be able to report results that are not reliable in the standard statistical sense, but suggestive, then one option is to use a lower statistical threshold. I don't think p<0.001 has much to recommend it as a lower threshold, as it has an arbitrary relationship to false positive / false negative trade-off that will depend on the characteristics of your data.
A p value refers to the probability of falsely rejecting a particular null hypothesis -- i.e the probability of making a type I error. The uncorrected p value refers to the null hypothesis for a single voxel, so uncorrected p values only have a useful meaning if the regional hypothesis refers to only one voxel. More commonly we have a hypothesis about a particular brain region which contains more than one voxel.
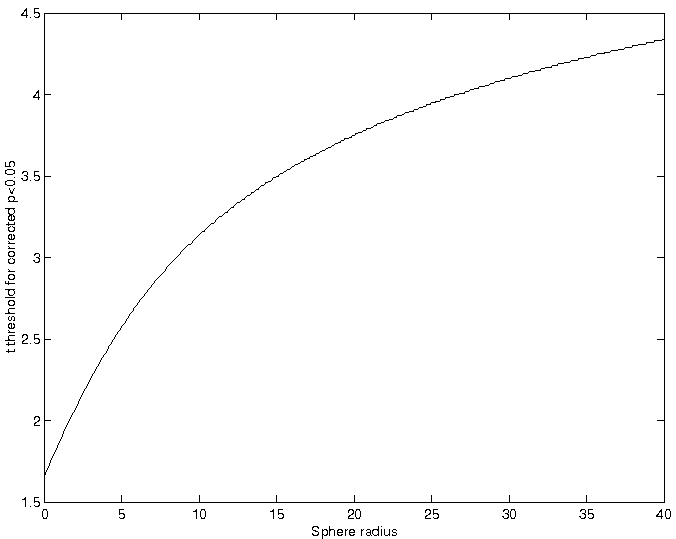
Using p<0.001 gives unquantified error control, because the actual error rate for a particular uncorrected p value depends on the size and shape of the hypothesized region, and the smoothness of the statistic image. For example; with 8mm smoothness, a spherical region with a radius greater than 6.7mm will require an uncorrected p value threshold of less than 0.001 for a FWE rate of 0.05. For a sphere of radius 15mm, an uncorrected p threshold of 0.001 gives an FWE rate of 0.36, so that there is approximately a 36% chance of seeing one or more voxels above threshold even if the null hypothesis is true.

(Figure shows the t threshold giving a FWE rate of 0.05, for spheres of increasing radius. Smoothness was 8mm in X Y and Z directions, and the example analysis had 200 degrees of freedom)
I (MatthewBrett) personally prefer less arbitrary thresholds for reporting suggestive results, such as reduced FWE correction (say correcting for volume or region p<0.1), or no threshold at all see UnthresholdedEffectMaps.
