Tutorial on using Mixed Models ANOVA in R
Sample data
Here is the header and first 10 lines of data from the file cleaned_small_1.csv. (The names of the variables will be read from the header line and have been shortened to a maximum of 7 characters just for legibility here.)
Subject Session Respons RT      Trial   Item    Accur   Task    Freq    N       LexStat
b       2       4       639     2       earn    correct S       H       L       W
b       2       5       596     3       suif    correct S               L       P
b       2       5       407     4       nomad   error   S       L       L       W
b       2       4       432     5       monk    correct S       L       L       W
b       2       4       509     6       gentle  correct S       H       H       W
b       2       5       699     7       lafe    correct S               H       P
b       2       5       990     8       tase    correct S               H       P
b       2       4       430     9       animal  correct S       H       L       W
b       2       5       705     10      swinch  correct S               H       P
b       2       4       566     11      lesson  correct S       H       H       W
...
Here's the structure:
Subject: 15 subjects.
Session: 2,3,5,6. The experiment contains four sessions.
- Session 2 and 3 are normal lexical decision task in which participants are told to distinguish between words and pseudowords.
- Session 5 and 6 are lexical decision with a deadline in which participants are told to make a very quick response (before 460ms).
Respons: which button they pressed. Participants are instructed to press right button when they see words and press the left button when they see pseudowords.
- 4=right hand
- 5=left hand.
Trial: order of stimuli presentation in each session
Item: words or pseudowords presented to participants
Accur: correct responses or errors
Task:
- S=normal lexical decision
- D=lexical decision with a deadline
Frequency:
- H=high frequency words
- L=low frequency words
- Pseudowords don't have this parameter.
N:
- L=low neighbourhood size
- H=high neighbourhood size.
LexStat:
- W=words
- P=pseudowords.
Importing the data
datafile <- "~/mixed_models_in_R/cleaned_small_1.csv"
sampledata <- read.table(datafile, head=T, row.names=NULL, sep=",")
# sampledata is a 'table', one of the basic R data structures.

names(sampledata)
# the list of variables in data

sampledata$session <- as.factor(sampledata$Session)
# session was interpreted as a numeric variable but we want to
# treat it as a factor - checked by is.factor(sampledata$session) evaluating as FALSE

sampledata$RT <- as.numeric(sampledata$RT)
# RT was interpreted as a factor because there is a 'space' lurking
# somewhere as one of its values - checked by in.numeric(RT) evaluating as FALSE
attach(sampledata) # this means we can reference variables directly # e.g. Subject rather than sampledata$Subject
Simple data checking
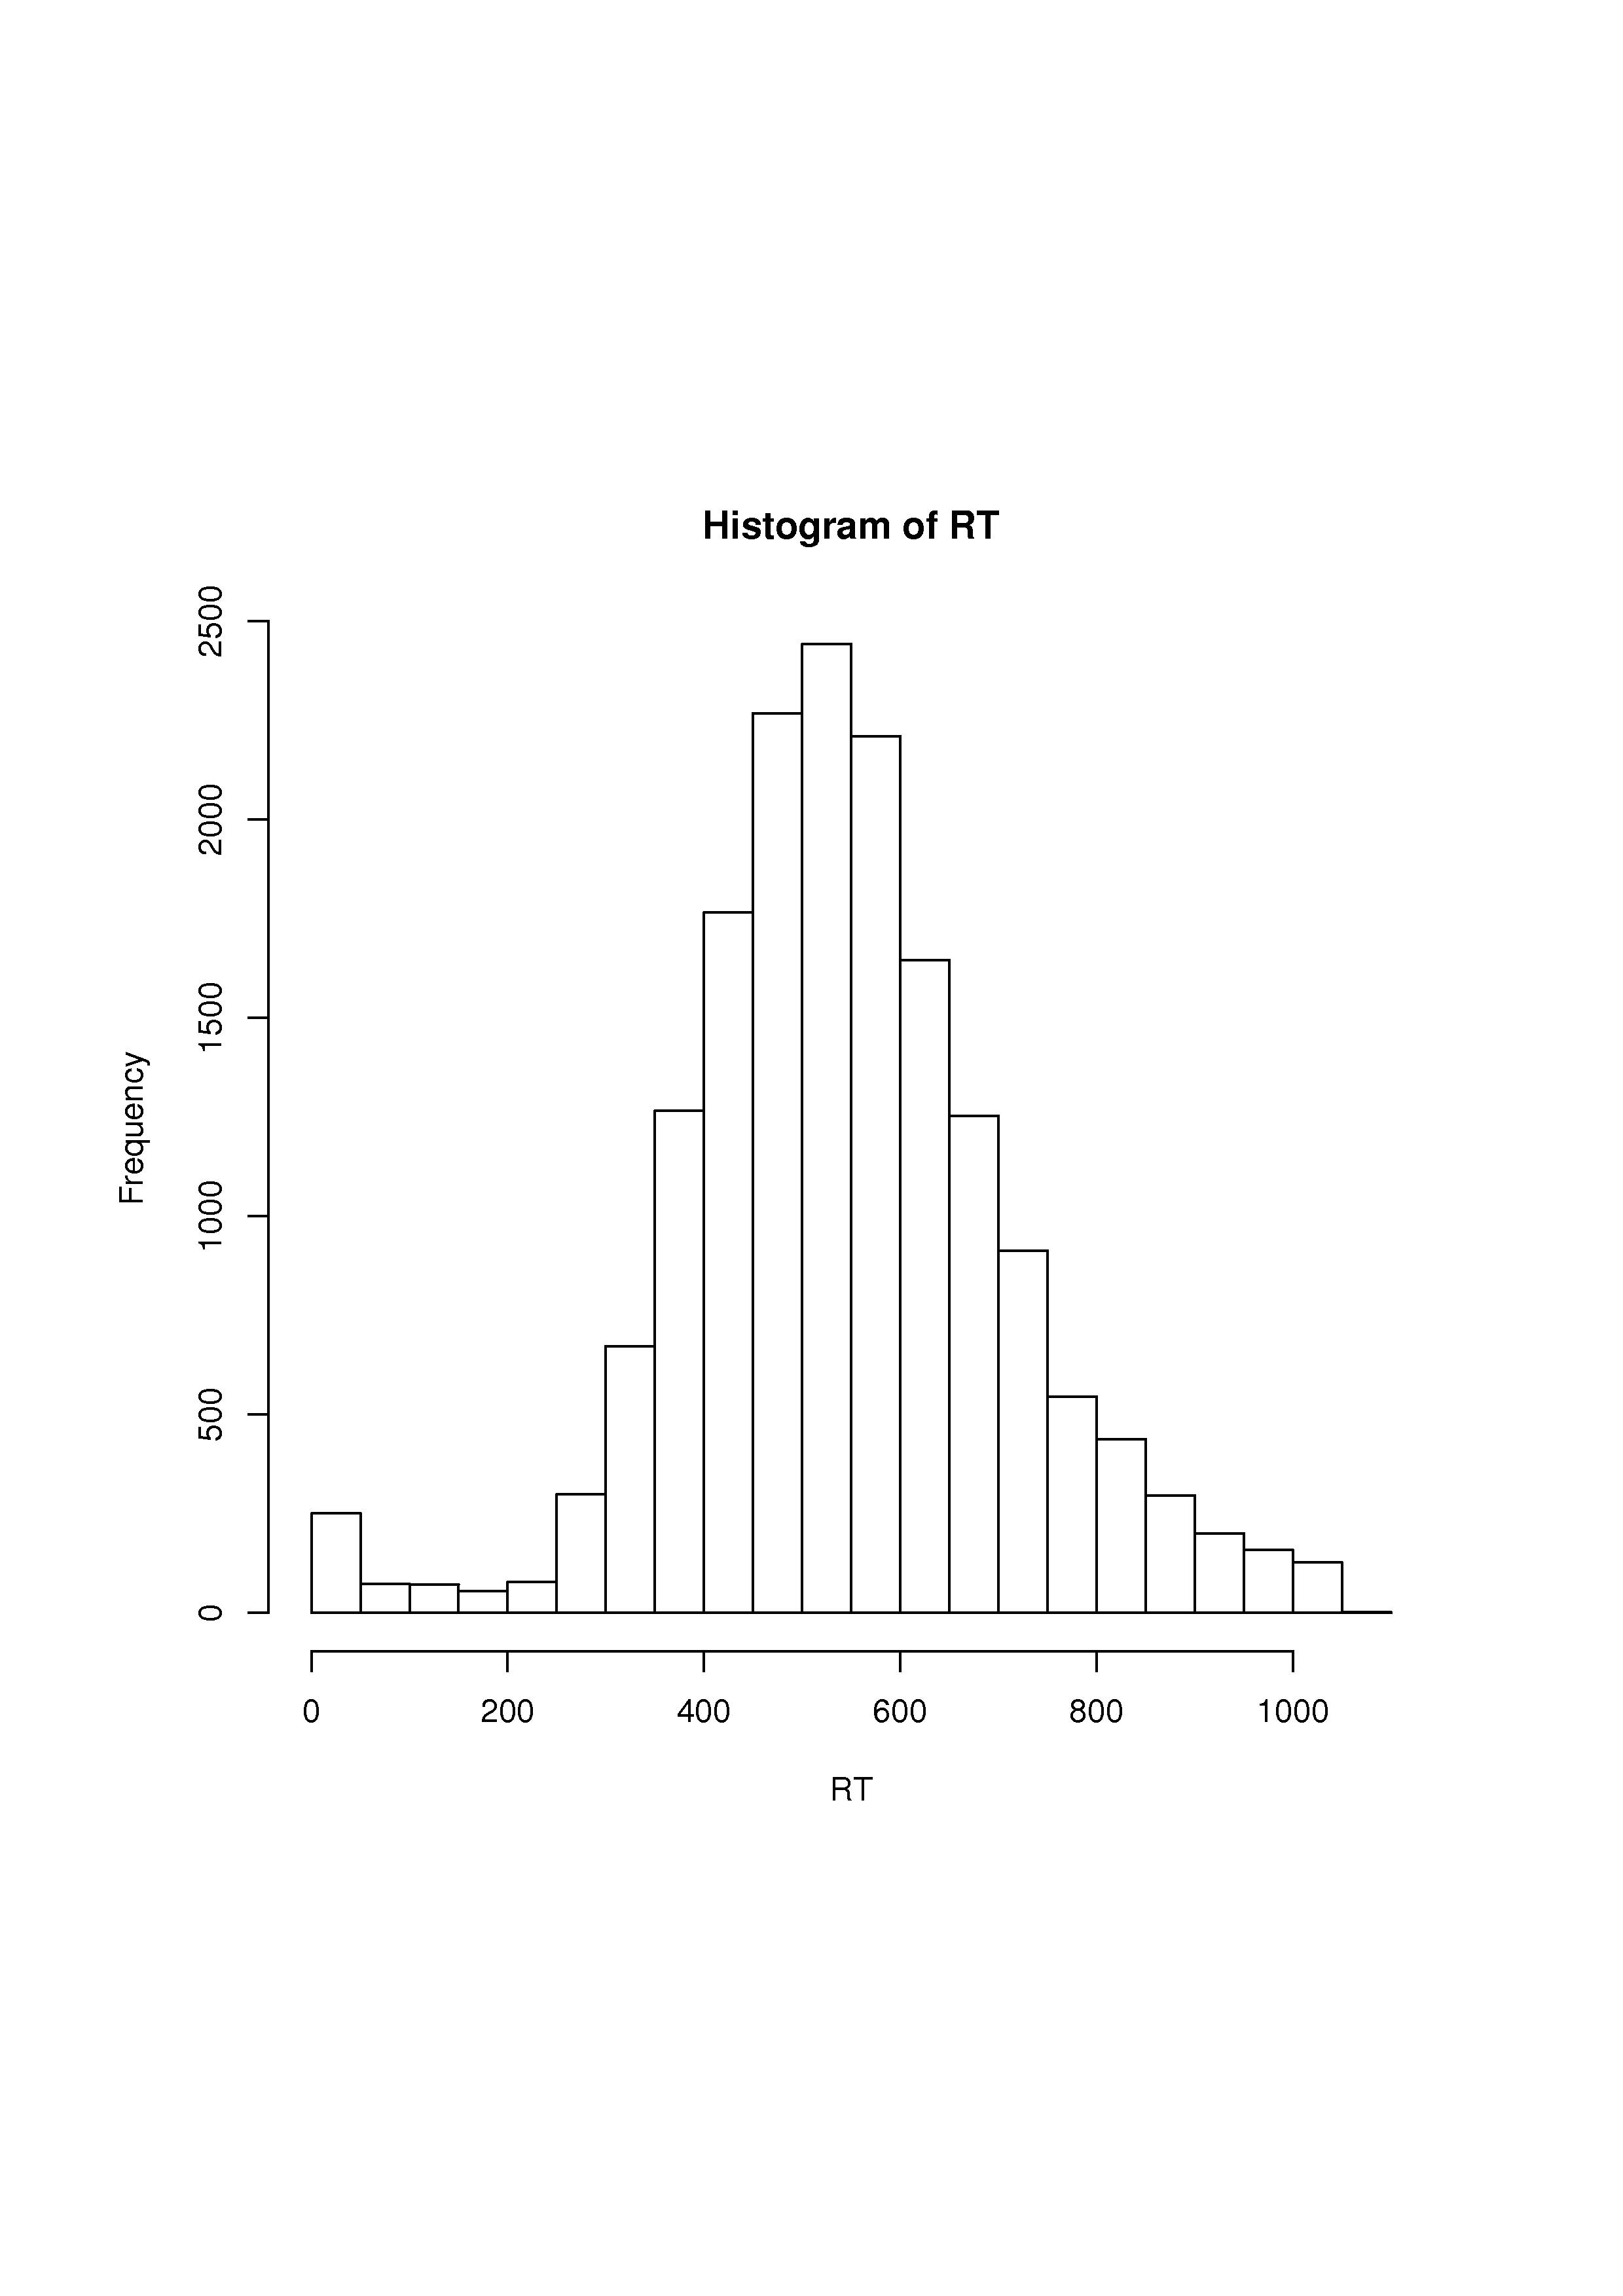
hist(RT)
produces this histogram which was saved as a png graphics file 
